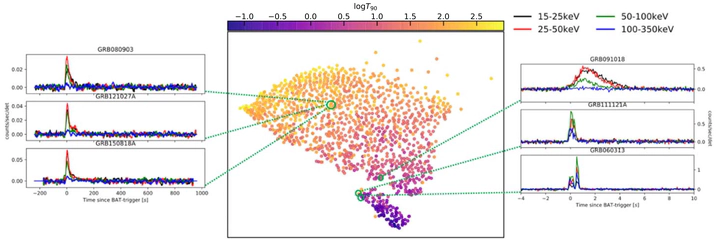
 t-SNE mapping of Swift light curves, colored based on duration
The duration of a gamma-ray burst (GRB) is a key indicator of its physical origin, with long bursts perhaps associated with the collapse of massive stars (also known as supernovae) and short bursts with mergers of neutron stars (kilonovae). However, trying to categorize these events from the burst itself is very troublesome, as there is substantial overlap in the properties of both short and long GRBs and neither duration nor any other parameter so far considered completely separates the two groups [insert figure]. Some very long bursts even show up without any observble supernova, even when we know exactly where it came from, which even led people to propose extra classes of bursts, like the Extended Short Gamma Ray Burst, to explain the lack of a supernova. In this project, which was done by myself and my two good friends Johann Bock Severin and Jonas Vinther as a semester project during our first year at the University of Copenhagen, we unambiguously classified every known GRB from the Swift Space observatory, using a dimensionality reduction algorithm, t-distributed stochastic neighborhood embedding, which had never been before and so was quite exciting. Although the classification takes place only using prompt emission light curves, every burst with an associated supernova is found in the longer group and bursts with kilonovae in the short, suggesting along with the duration distributions that these two groups are truly long and short GRBs, or some sort of proxy.
Since t-SNE works by comparing vectors dimension by dimension, it was crucial that each dimension actually meant the same for each burst. Unfortunately, there is a great deal of uncertainty surrounding exactly when a burst begins or ends, so the lightcurves where rarely aligned such that the first second of a given burst meant the same as the first second of any other burst. The trick behind getting this to work was shifting the bursts from the time domain into the frequency domain using the ‘Fourier Transform’, which eliminates temporal translational differences in the lightcurves and makes it possible to actually compare the bursts dimension by dimension!
Running the machine learning algorithm on the Fourier transformed light curves let’s us get these two beautiful groups! TSNE GROUP FIGURE
One of the interesting things that came out of this project was to determine that those supernovae that we couldn’t find before go firmly in the group with all the other supernovae, so we’re pretty sure that they actually exploded, but the exact mechanism that led to an explosion with no visible supernova is still unknown. Professor Darach Watson at DAWN Copenhagen [link] currently has my favourite theory for why this is: Instead of the star exploding and then turning into a black hole, it would BOLD ‘implode’ and turn directly into a black hole!
Anyone who wishes to do anything similar to this project is encourage to read the paper and check out the [Github](https://github.com/astrockragh/GRB_TSNE. Currently, we wish to extend this analysis to other observatories, getting thousands of new bursts included in the analysis!
Christian Kragh Jespersen
PhD Candidate in Astrophysical Sciences
My research interests are at the intersection between Machine Learning, galaxy formation and evolution, big surveys, and cosmology